PCLN DETAILED - TradeTheMBI1
Main menu:
PCLN DETAILED
Here we will use PCLN from daily to the intra-
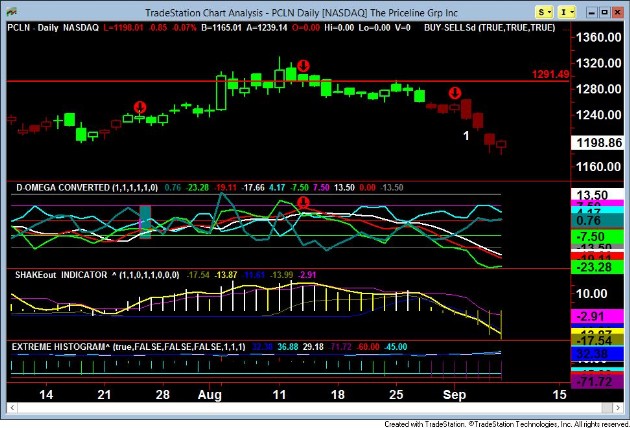
We start with the PCLN daily and define a few key spots from middle of chart and then we will move to the right-
At chart center we have a RED arrown around the 1291 and in the DOC indicator in 1st sub-
Cyan above the green is 1st, and then second is cyan above RED, if not we dont expect a deep contraction. The trigger for shorter side is the steel line move below the cyan as steel represents our short term buyers, therefore steel is moving lower this means they are not active at this time and the balance has moved to bears if cyan is over green. If green had been over cyan then green buyer would have the lead over the steel fast buyers. Moving to the middle sub-
The broader expectation for a BIGGER decline comes when cyan DOC move above red and we start getting lower red. By Aug. 25 we have the bull last gasp as the green DOC and cyan DOC meet and cyan moves up and green lower and our expectation of a faster fall begins to mount.
As you see the chart paintbar turns to deep RED and shakeout turns yellow histograms and starts decline. The #1 appears to let us know that RED DOC has moved below -

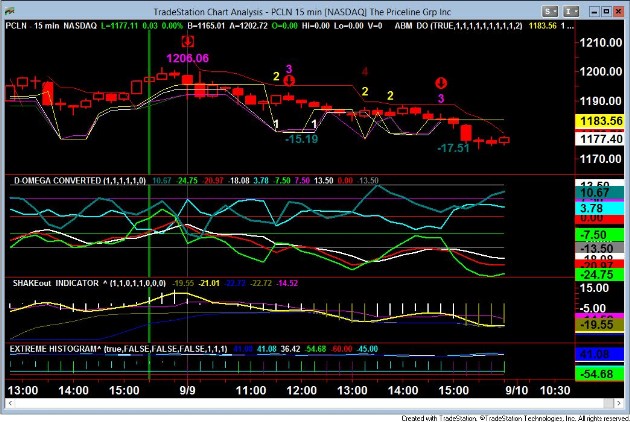
This 15min chart from Monday Sept 8,2014 shows all the way back to start of month and RED arrows showing the SAME setup as the daily did on more recent. The 2nd red arrown shows DOC cyan is above red,green,white,and steel. The Shakeout held up for 1 bar but by next we see the deep RED ,now a normal read of DOC where steel does NOT come from under the green and green then crosses red is an early indication of a continued weak setup. Why? The steel long player are not engaged in adding to the position, something we saw on daily as well, this is why when you see the #2 BUY signal, they have a #4 above, telling you that any pop will not do well and you can look to fade pumps in price.

On this chart we move to a close up of last day plus. we see mid chart the dotted vertical, coming off the reversal but again the Green DOC fails to cross the cyan and the pivot away is the short signal. Also we see steel moving above the +13.5 line and the tip down of that is usually followed by several weak bars. the next buy comes at start of Monday 9-
The blue trendline shows the rising red DOC line, but we have to note the Steel line did NOT come from under the green or from above the +13.5 and suggest ANY pop in the short term here will not last! This type of detail allows us to understand which BULL and BEAR signals have a greater expectancy. While PCLN is exaggerate in its beta it points out how the algorithm trading impacts price and intensity. We did not cover here the positive extreme histograms that often give us retrace levels to work from as it was not relevant to this current chart and how to read from daily to 15min timeframe.
Tuesday PCLN Intra-
End of day we see 1st sign of turn as shakeout histogram improves just a fraction,and short stop is very tight at that point. The yellow line at price of 1183 becomes a buy above level.

After the big sell-