SPOTLIGHT CHART - TradeTheMBI1

Go to content

Main menu:

SPOTLIGHT CHART


TradeTheMBI Spotlight Chart

SBUX DAILY CHART

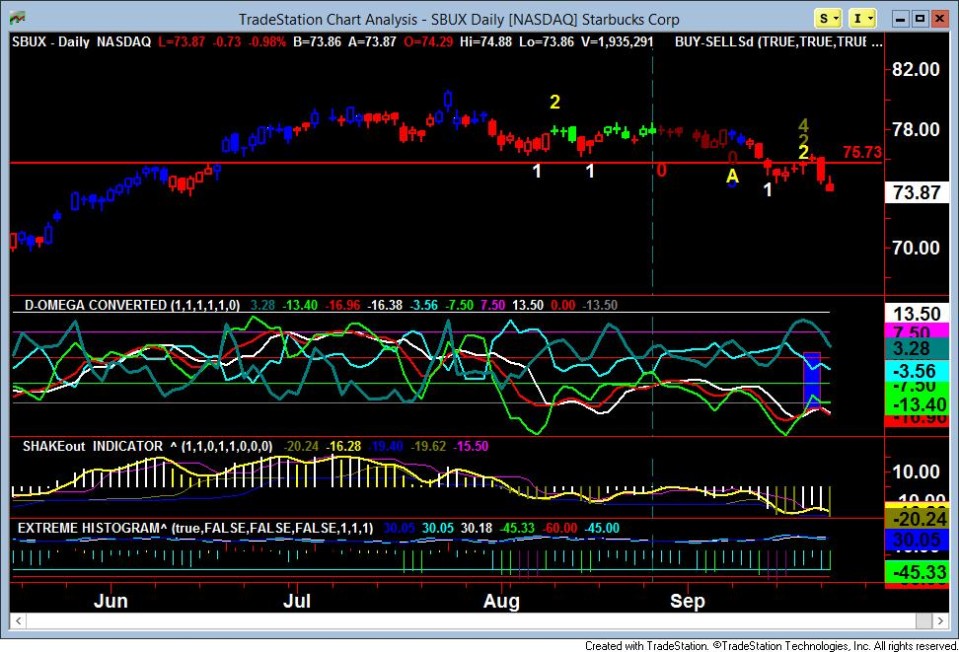
Starbucks daily chart above, at the dotted vertical in late August show where Bulls failed to extend the run. In the DOC(d-omega converted ) indicator we see the bearish cyan line move above the bull lines of green,red,white. The final straw is the steel color line moving below cyan and its open for a short attack. In the last few days the #2 buy signal was produce but when the #4 appears above we understand that only short term buyers are at the table and expect lows to be retraced and that is where price is at now.

SBUX 78 MINUTE CHART

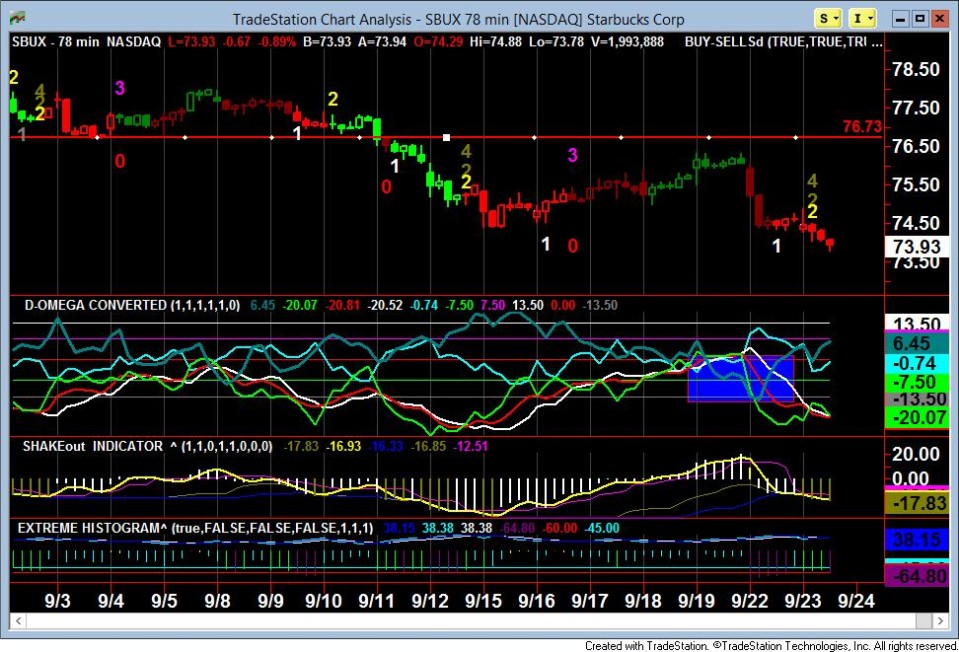
The 78min Starbucks chart shows the final breakdown on 9-11 and when DOC steel fails to come from under the green line to above we understand that pops in price should be treated as short opportunities and not long setups. The current buy signal of #2 that happened on Tuesday also had the #4 which indicated the long would fail and that is what happened. Even a bounce near term is not likely to succeed unless SBUX has improved readings on the shakeout indicator with the histogram inside of -12. The current reading is -17.

We will keep an eye on this one for a turn in the readings but for now , not interested in the long side just yet.


Back to content | Back to main menu