TRADE SETUPS - TradeTheMBI1
Main menu:
TRADE SETUPS
Trade Setups Using the DOC
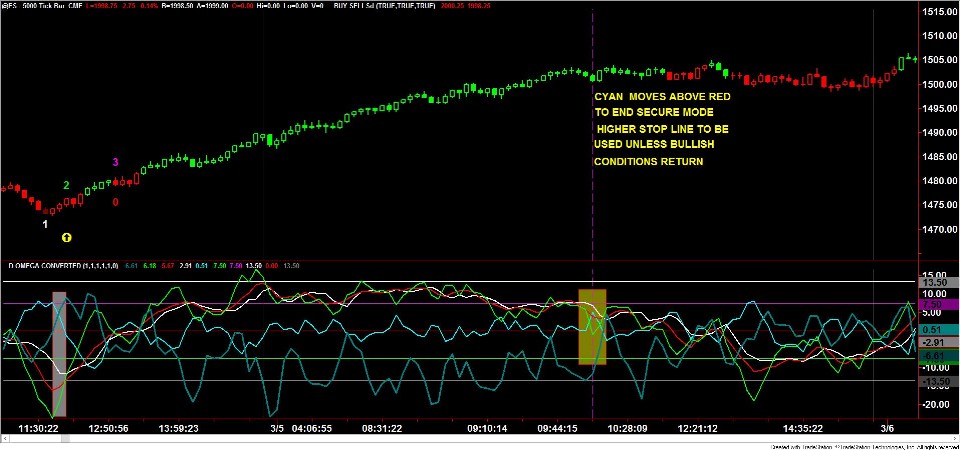
CYAN PIVOT SETUP AND DETAILS
The below image depicts E-
Cyan Pivot Buy Signal
Cyan Up Pivot below negative 6.85 (-
6.85) (Normal Set Up) Red DOC is Rising (See Slideshow)
If Steel DOC is greater than 13.5 (> +13.5) Wait 2 bars for Entry. This Special Setup occurs occasionally.
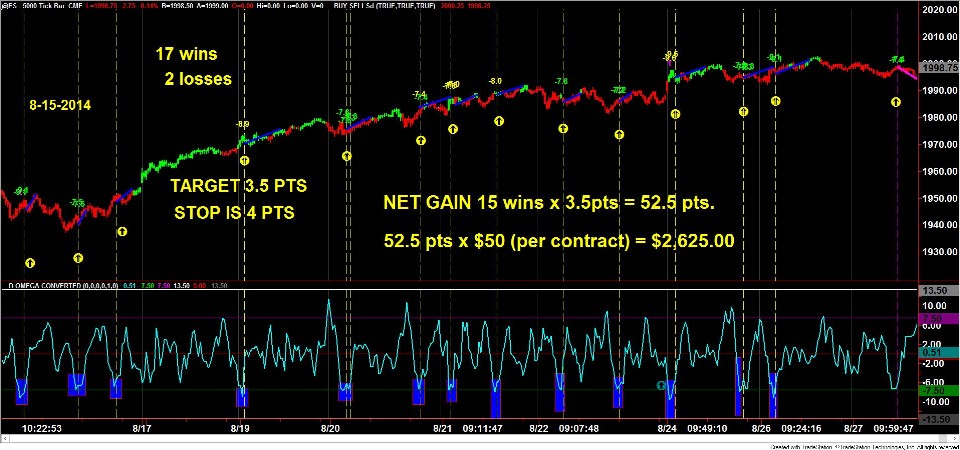
Profit Target is +3.5 Points
Stop Loss is equal to 4 Points from Entry
Green Pivot numbers above price indicate Cyan is above Red at signal
Yellow Pivot numbers above price indicate Cyan is below Red at signal (More Bullish configuration)
Green DOC above +13.5 very rare indicates exhuastion push, use caution and tighten stop sooner.
1,2,3 Buy
8 Point Stop, Target is Following the ABM Stop
Multiple Contracts after achieving 2.5 points lock in a gain